
Performance Analytics: Measuring How Speed Affects Conversion
Bringing Google PageSpeed Metrics into Looker Studio – A Free & Automated Approach to Reporting on Website Speed and Performance


A few weeks ago, I found myself searching for a way to bring Google PageSpeed Insights data directly into Looker Studio—without expensive third-party tools. I wanted a simple, automated approach that would allow me to monitor website performance and identify areas for optimization.
After some trial and error, I figured out how to do it using free* tools: the Google Cloud PageSpeed API, Google Sheets, and a bit of Google Apps Script automation.
I’m still refining my approach as a digital analyst and marketer, always looking for affordable and approachable ways to bring data together. But this method got me pretty excited (and revealed some valuable insights!), and so I wanted to share it with you.
*Free with any Google Workspace account
Why Track PageSpeed in Looker Studio?
Website speed matters. It’s a key factor in Google’s ranking algorithm, and Core Web Vitals metrics influence both search rankings and user experience. There’s also evidence that slow-loading pages can impact Google Ads costs—though this depends on specific factors within the ad auction system. Regardless, keeping an eye on site performance through Google’s own metrics is invaluable for SEO, UX, and overall site health.
For marketers, a slow-loading site can lead to higher bounce rates, lower engagement, and missed conversion opportunities. For data analysts, incorporating PageSpeed data into a Looker Studio report provides a tangible way to start analyzing technical performance and connecting it to user behavior.
Ultimately, I would like to develop a “Website Health and Growth Score” that blends technical performance, user experience, and conversion rates. PageSpeed is one of those foundational elements, so I needed a way to pull the data dynamically into Looker Studio.
If you prefer a visual walkthrough, I’ve also recorded a step-by-step tutorial on YouTube.
How I Automated Google PageSpeed Data in Looker Studio
Instead of manually running PageSpeed tests (which you can do here), I wanted the data to update automatically in Looker Studio. Here’s how I set it up:
1. Creating a Google Sheet for Storage
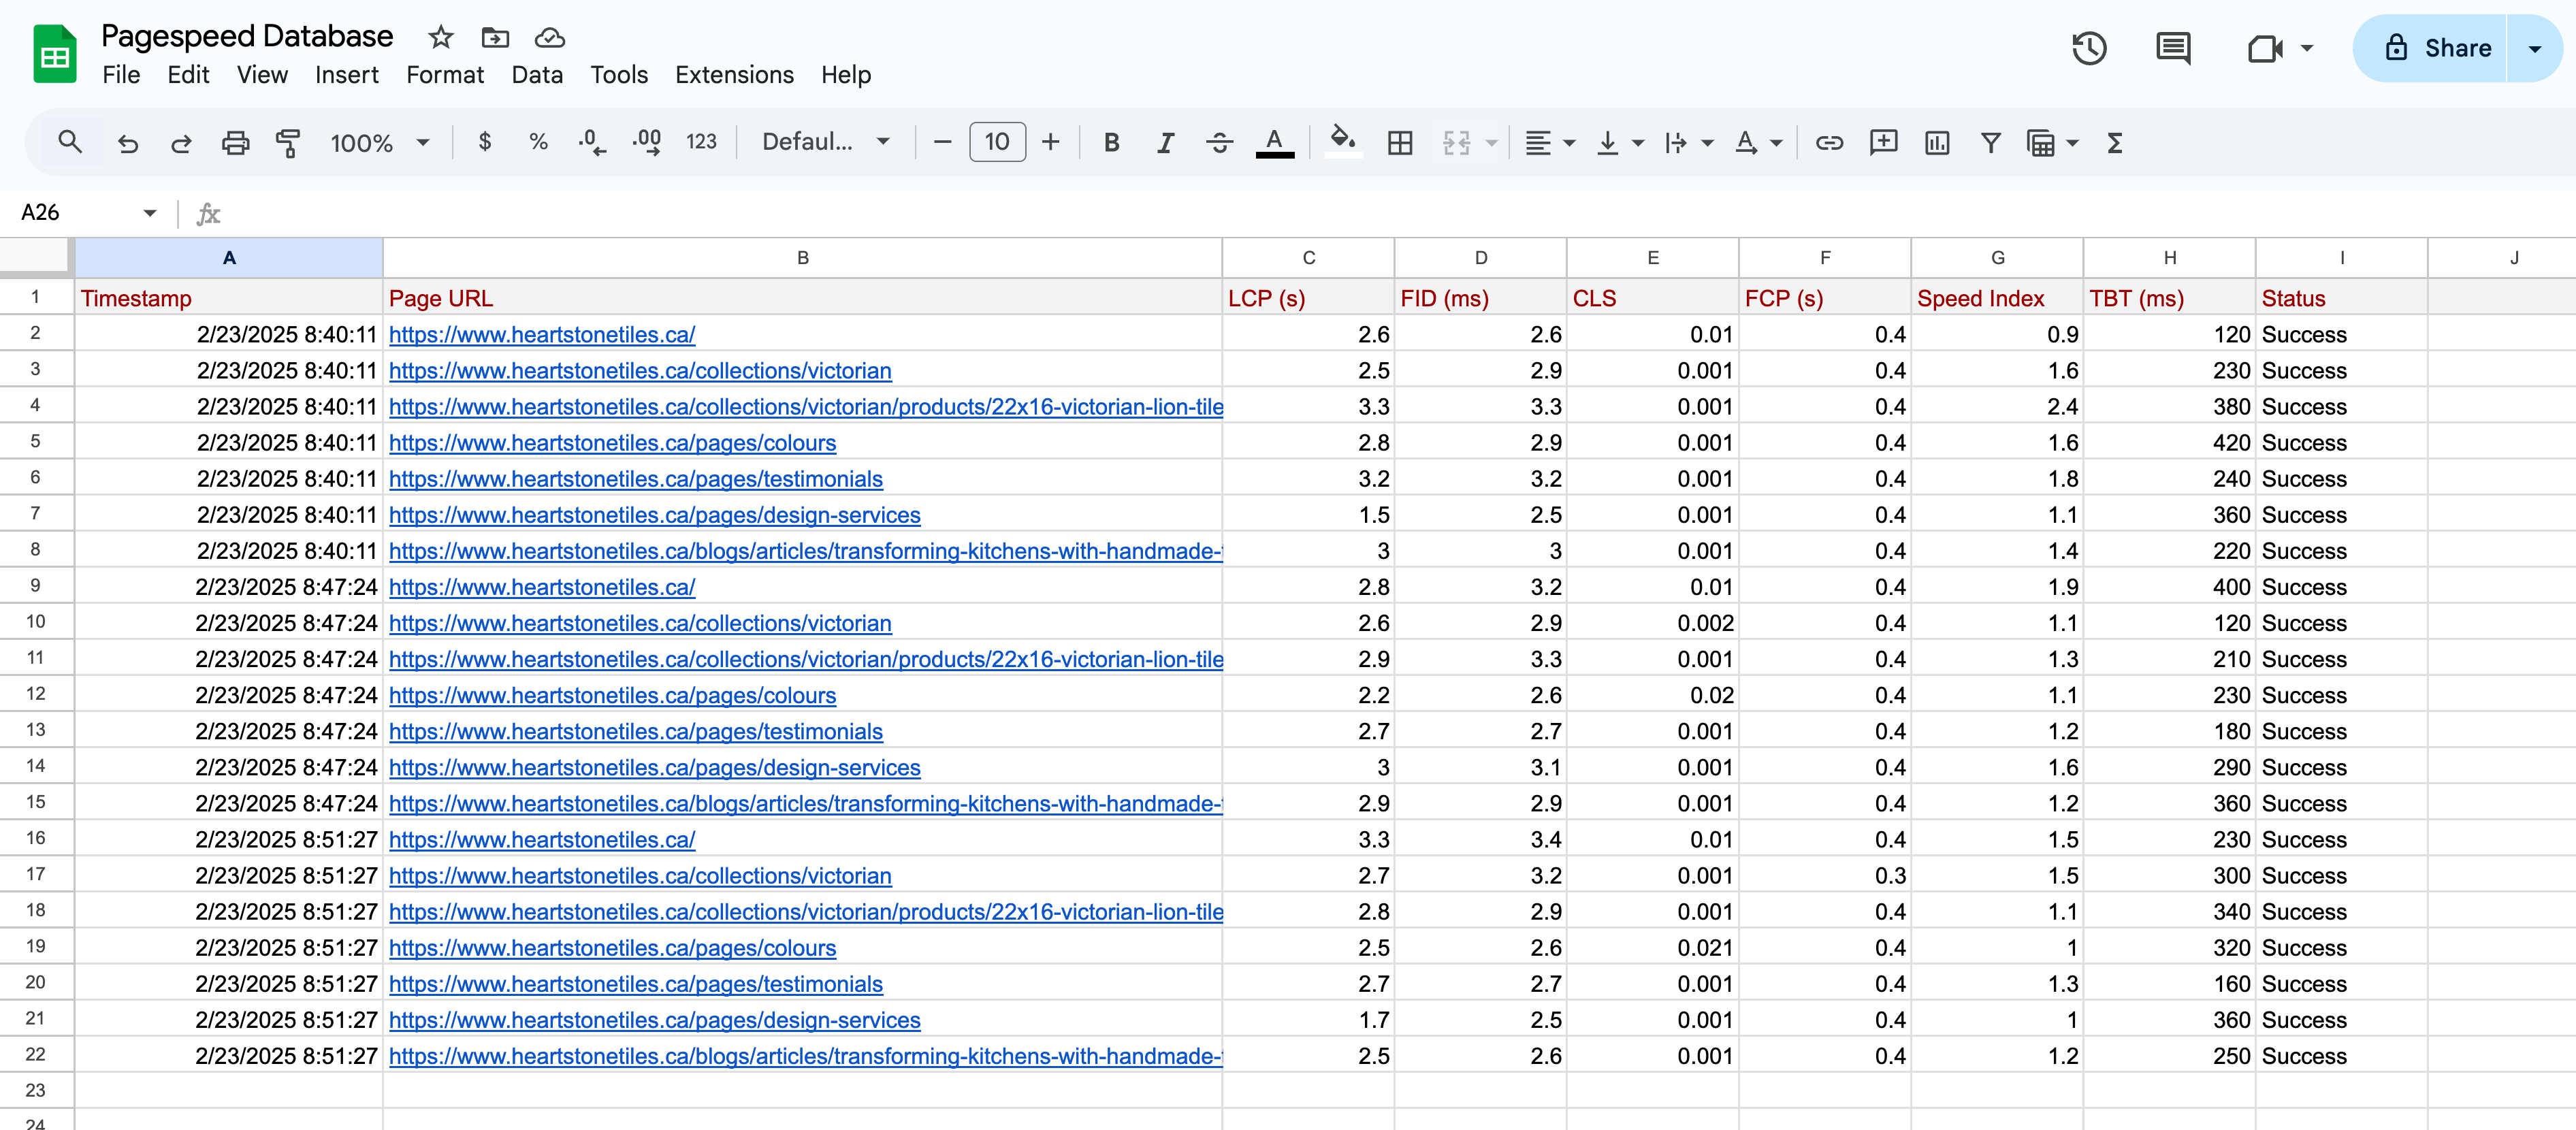
I started with a simple Google Sheet to store the PageSpeed data. Eventually, I’d like to use BigQuery for better scalability, but this was a quick and effective way to test the concept before optimizing.
For those unfamiliar with Google Sheets as a data source, it’s a versatile tool that integrates seamlessly with Looker Studio, making it an easy starting point for automated reporting.
Google Sheets has a 10 million cell limit per spreadsheet (across all sheets), which can be a constraint for large datasets. For handling larger-scale data efficiently, Google BigQuery is a more scalable and strategic solution.
2. Generating a Google PageSpeed API Key

Next, you will need to setup a free Google Cloud project and enable the Pagespeed Insights API.
Once you have this enabled, you can generate your API key by following Google’s documentation and clicking the “Get a Key” button on this page. The workflow will ask for you to select your Google Cloud Console project and next will reveal the key. Copy and save this API key for future reference in the next steps.
3. Writing a Google Apps Script for Automation

If you’re new to automation, Google Apps Script is a JavaScript-based language that allows you to extend the functionality of Google Workspace tools like Sheets, Docs, and Drive. It’s an easy way to automate data collection without needing a full backend system.
Using ChatGPT, I created a Google Apps Script that:
Runs selected website pages through the PageSpeed API
Retrieves the performance data
Inputs the results directly into my Google Sheet
You can find the script on my GitHub page if you’d like to use it.
4. Setting Up an Automated Daily Trigger

Within the Google Apps Script editor, I created a daily trigger so the script runs automatically. This ensures the data stays up to date without manual intervention. For marketers or analysts managing multiple sites, this automation eliminates the need for repeated manual testing, freeing up time for deeper analysis.
5. Connecting the Google Sheet to Looker Studio
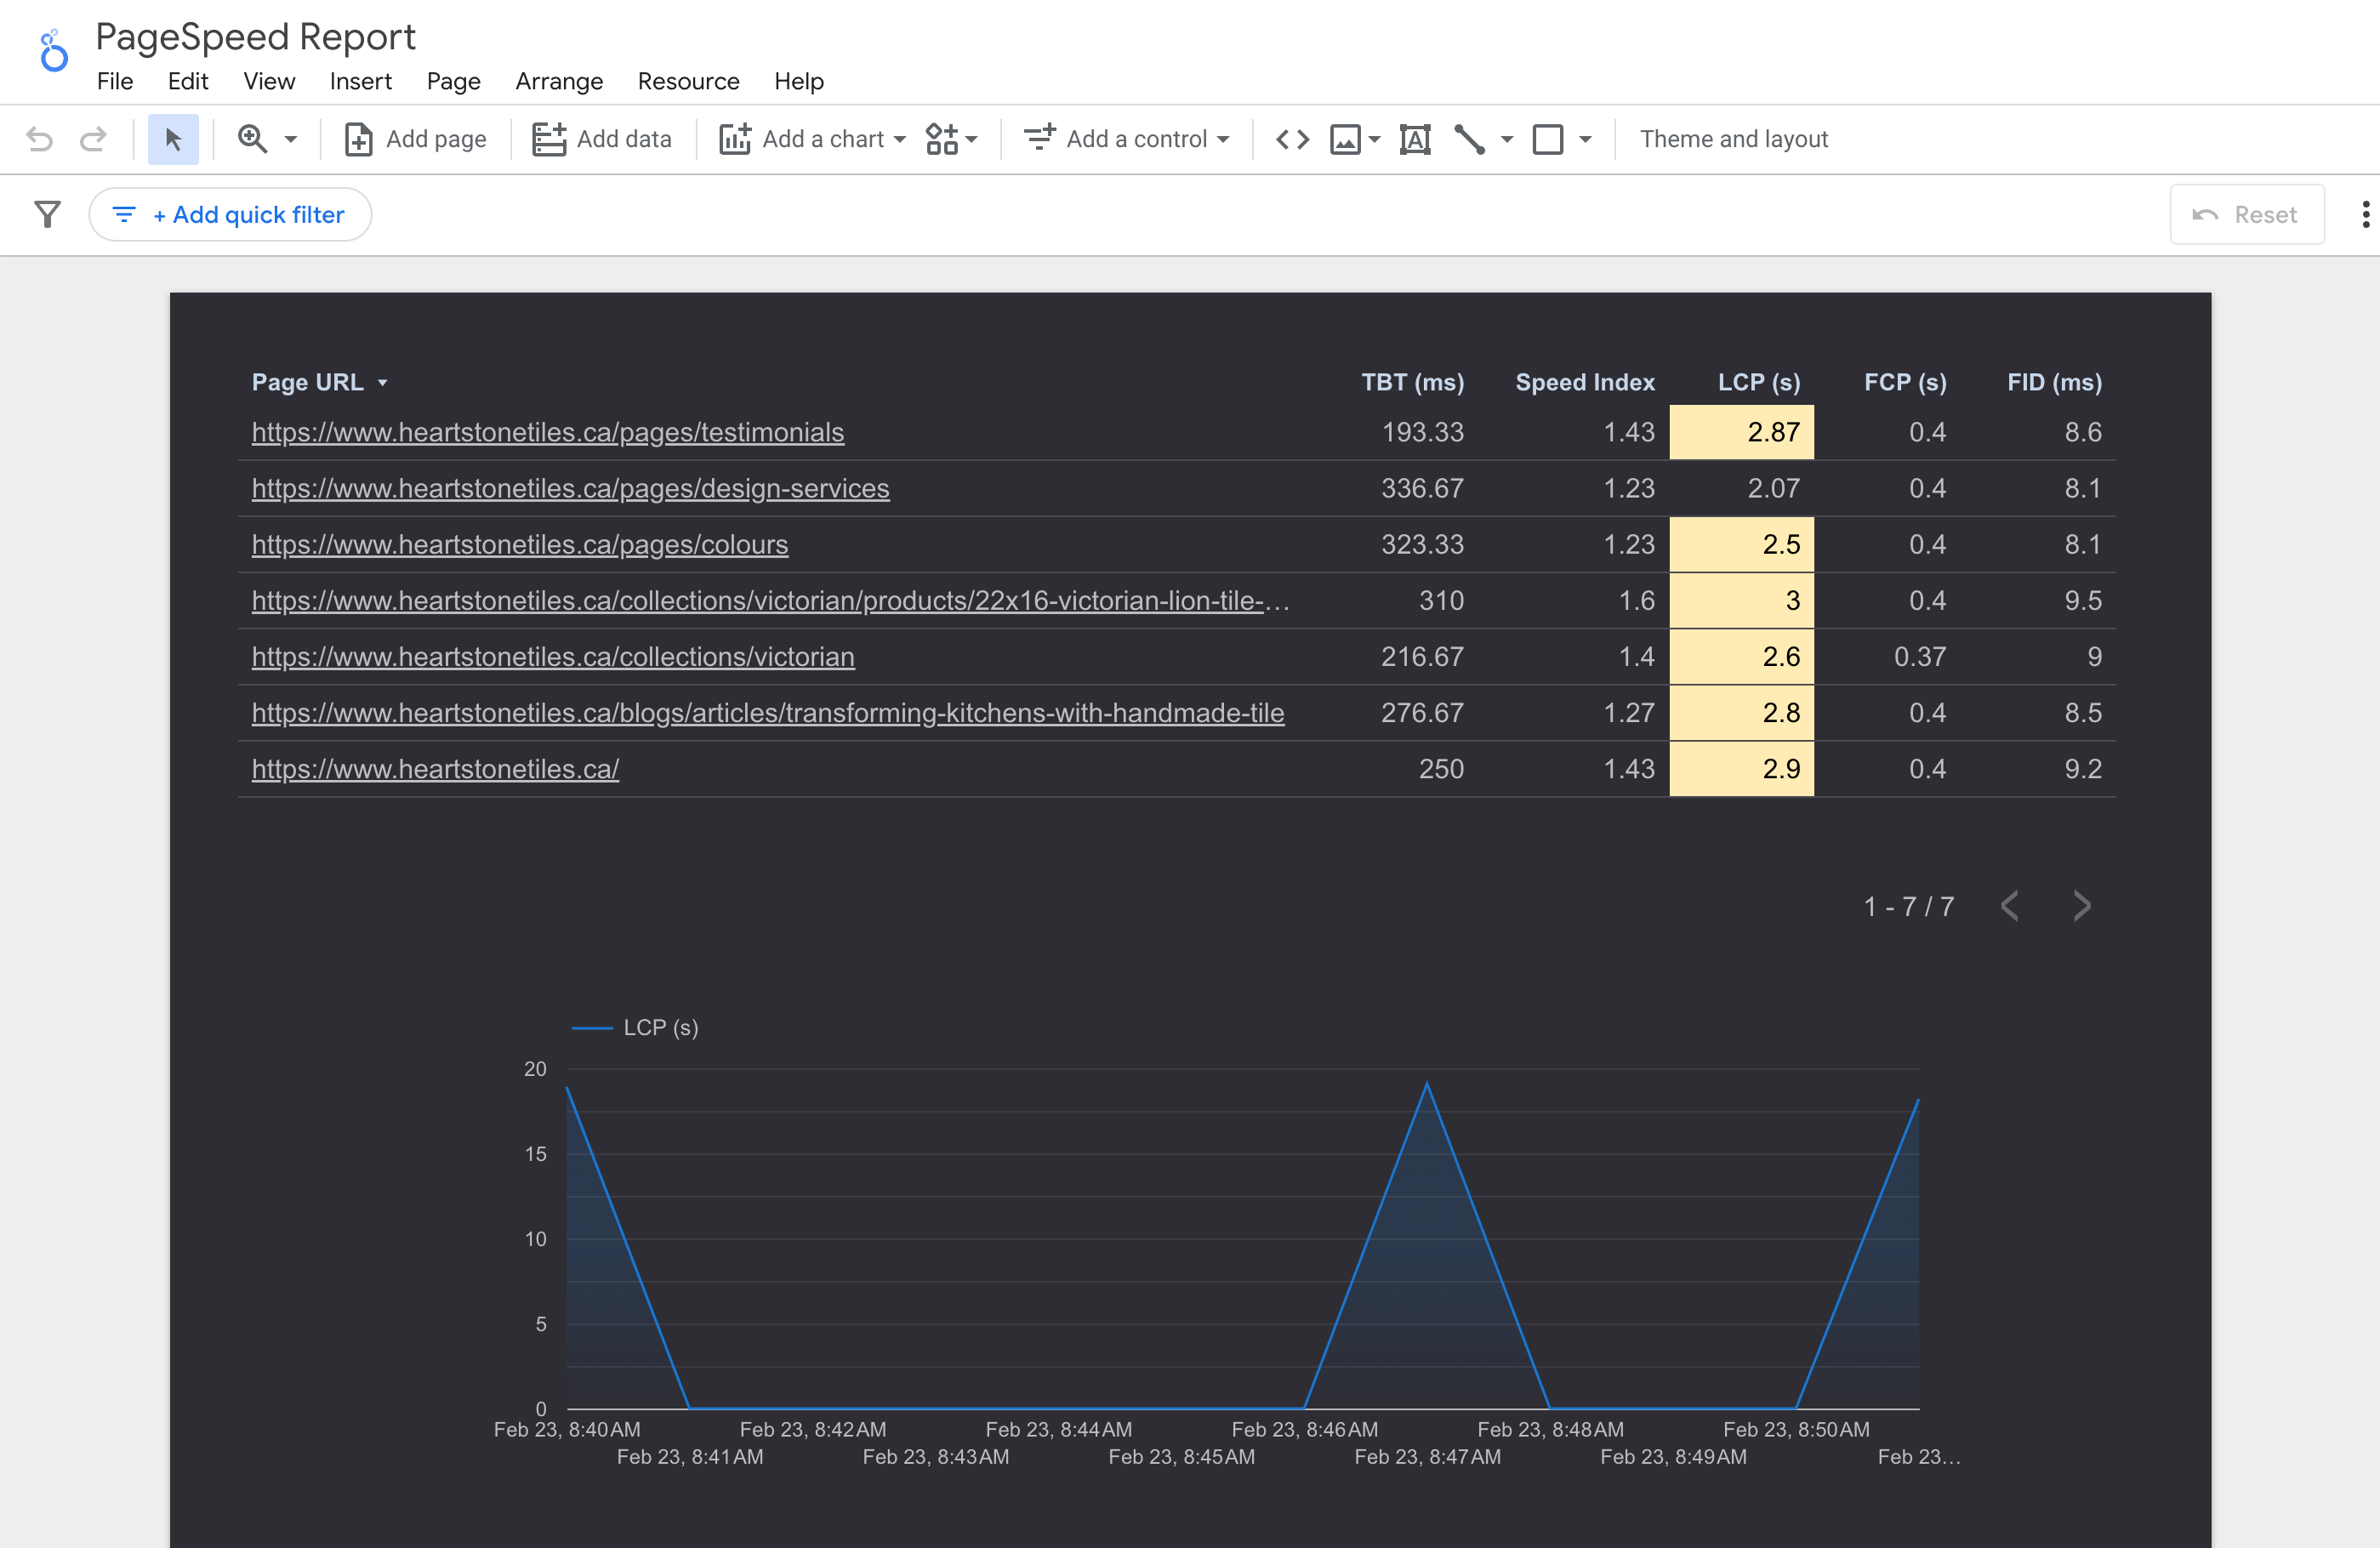
Once the data was flowing into my Google Sheet, I linked it to Looker Studio. From there, I could create tables and scorecards to visualize the insights.
A key tip: when configuring metrics, set them to Average rather than Sum—otherwise, the numbers may appear misleadingly high.

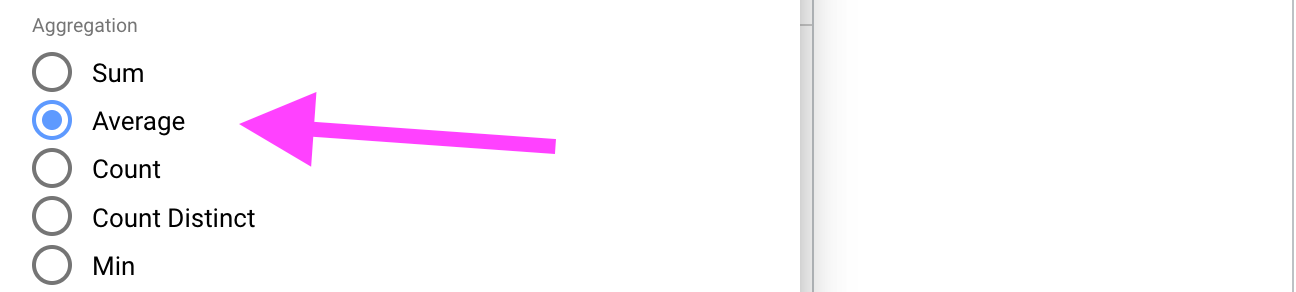
For those new to Looker Studio, this step is essential to ensure accurate reporting. Looker Studio’s default aggregation settings can sometimes distort data, so double-checking how metrics are displayed is crucial.
6. Adding Conditional Formatting for Clarity
To make the reports more intuitive, I applied conditional formatting based on Google’s PageSpeed best practices (reference here). Green, yellow, and red indicators made it easy to see which pages needed attention at a glance. This is especially useful for marketing teams that need a quick, visual way to identify performance issues without digging into raw numbers.
Alternative Approaches
If you have access to paid services like Airbyte or Supermetrics, you might find an even more user-friendly way to query and import PageSpeed data. Additionally, tools like Google Cloud Functions or Google Dataflow could be used for a more scalable solution. However, I found this free approach worked perfectly fine.
Try It & Share Your Results
If you follow this process, let me know how it works for you! Did you run into any issues? Do you have suggestions for improvement? How do you plan to use this data in your marketing or analytics workflows? I’d love to hear about your experience.